Data Visualization with Google Colab
Data visualization with Google Colab has become an indispensable tool in the world of data analysis. It involves representing data in graphical or pictorial format to uncover insights, patterns, and trends that might not be immediately apparent from raw data alone. Google Colab, a cloud-based platform provided by Google, offers powerful tools for data visualization, making it accessible to users of all levels.
Introduction to Data Visualization
Data visualization is the graphical representation of information and data. It allows data analysts, scientists, and decision-makers to interpret complex datasets more easily, identify trends, outliers, and patterns, and communicate findings effectively. The importance of data visualization lies in its ability to turn abstract numbers and statistics into visual stories that are easily understandable.
Benefits of Data Visualization
- Enhanced Understanding: Visual representations make it easier to grasp complex concepts and relationships within the data.
- Improved Decision Making: Visualizations enable quicker and more informed decision-making by presenting data in a clear and actionable format.
- Identification of Trends: Visualizations help identify trends, correlations, and outliers that may not be obvious from raw data.
Overview of Google Colab
Google Colab, short for Google Colaboratory, is a cloud-based platform provided by Google that allows users to write and execute Python code in a collaborative environment. It offers free access to GPU and TPU for machine learning tasks, making it popular among data scientists and machine learning enthusiasts.
Introduction to Google Colab
Google Colab provides a Jupyter notebook environment that runs entirely in the cloud. It eliminates the need for users to set up their own development environment and provides seamless integration with other Google services such as Google Drive.
Features and Capabilities
- Free Access: Google Colab is free to use and provides access to high-performance computing resources.
- Collaborative Editing: Multiple users can collaborate on the same notebook in real-time.
- Integration with Google Services: Google Colab seamlessly integrates with Google Drive, allowing easy access to datasets and files stored in the cloud.
Getting Started with Google Colab
To get started with Google Colab, users need to create a Google account if they don’t already have one. Once logged in, they can access Google Colab through their web browser.
Setting up a Google Colab Account
Users can sign in to Google Colab using their Google account credentials. If they don’t have a Google account, they can create one for free.
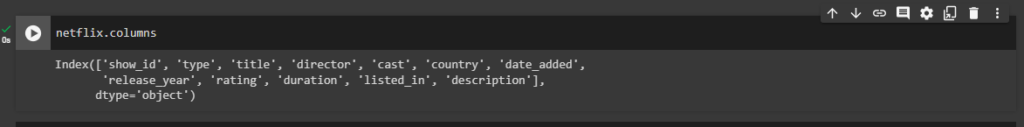
Understanding the Interface
The Google Colab interface consists of a toolbar at the top and a code cell below. Users can write and execute Python code in the code cells and see the output immediately below each cell.
Data Importation and Preparation
Before visualizing data in Google Colab, users need to import the dataset into their notebook and prepare it for analysis. for getting the full visualization contact me .
To import a CSV file in Google Colab, you can use the following steps:


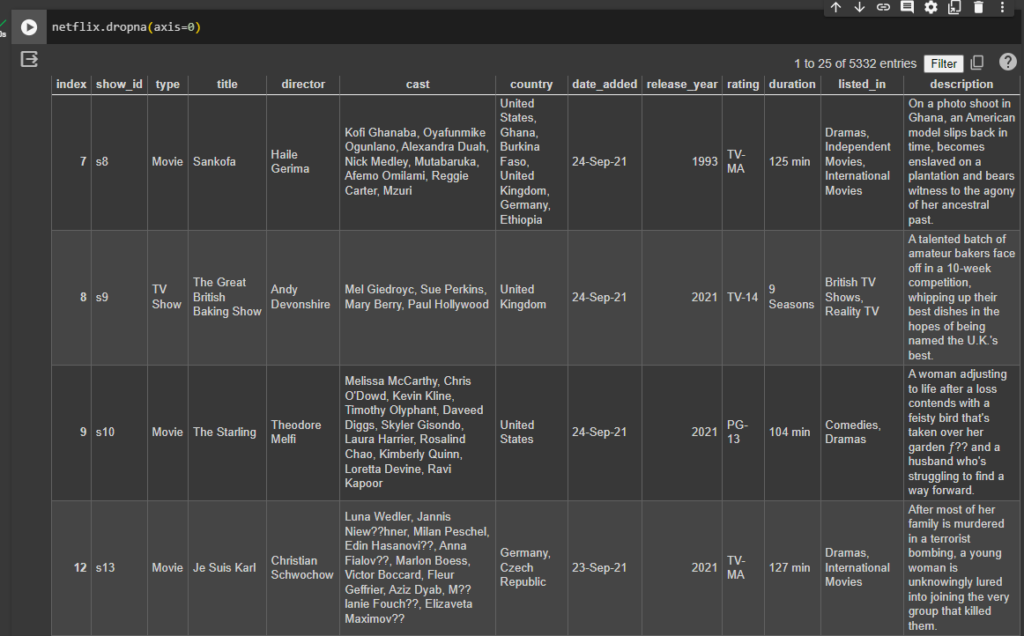
Preparing Data for Visualization
Data preparation involves cleaning, transforming, and organizing the dataset to make it suitable for visualization. This may include removing missing values, standardizing data formats, and filtering out irrelevant information.
Basic Data Visualization with Google Colab Techniques
Google Colab offers a range of tools and libraries for creating basic charts and graphs to visualize data.

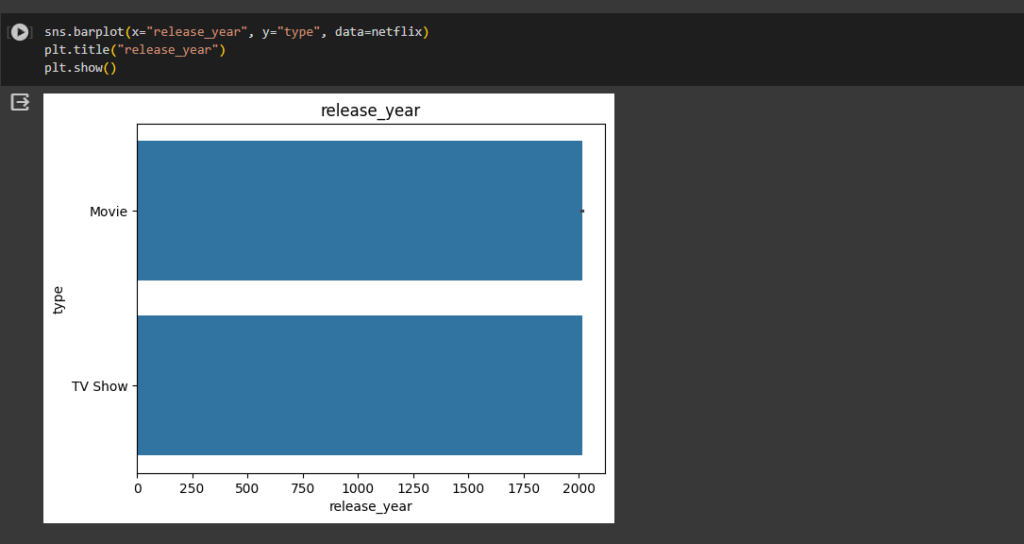
Creating Basic Charts and Graphs
Users can create basic visualizations such as bar charts, line graphs, scatter plots, and pie charts using popular Python libraries like Matplotlib and Seaborn.
Customizing Visualizations
Google Colab allows users to customize the appearance of their visualizations by changing colors, fonts, labels, and other parameters to make them more visually appealing and informative.
Advanced Data Visualization Techniques
In addition to basic charts and graphs, Google Colab supports advanced data visualization techniques that enable users to create interactive and dynamic visualizations.
Utilizing Interactive Visualizations
Interactive visualizations allow users to explore data dynamically by interacting with elements such as sliders, buttons, and dropdown menus.
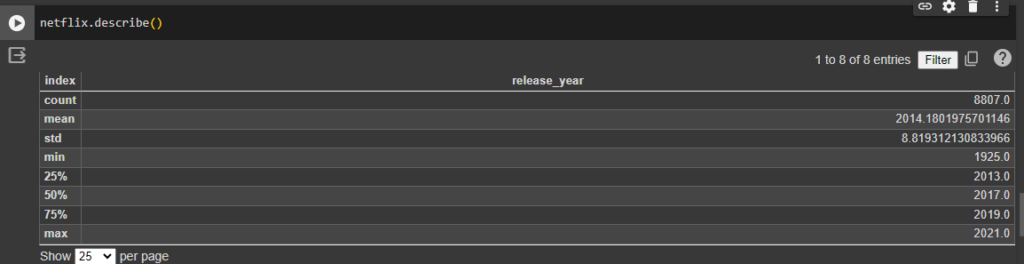
Incorporating Statistical Analysis
Google Colab integrates with libraries like Pandas and NumPy, allowing users to perform statistical analysis on their data and visualize the results using advanced techniques such as heatmaps and box plots.
Sharing and Collaborating with Google Colab
One of the key features of Google Colab is its ability to facilitate collaboration and sharing of data projects.
Sharing Visualizations with Others
Users can share their Google Colab notebooks with others by generating shareable links or inviting collaborators via email. This allows them to showcase their visualizations and collaborate on data analysis projects.
Collaborating on Data Projects
Google Colab enables real-time collaboration, allowing multiple users to work on the same notebook simultaneously. This fosters teamwork and knowledge sharing among data scientists and analysts.
Best Practices for Data Visualization with Google Colab
To create effective visualizations with Google Colab, it’s essential to follow best practices to ensure clarity and readability.
Choosing the Right Visualization Type
Selecting the appropriate visualization type based on the nature of the data and the insights to be conveyed is crucial for effective communication.
Designing Clear and Effective Visualizations
Visualizations should be designed with the audience in mind, ensuring that they are easy to understand and interpret. This includes using appropriate labels, titles, and annotations to provide context and clarity.
Conclusion
In conclusion, data visualization with Google Colab offers a powerful and accessible way to explore, analyze, and communicate insights from data. By leveraging the features and capabilities of Google Colab, users can create visually compelling and informative visualizations that drive decision-making and drive innovation.
FAQs (Frequently Asked Questions)
Can I use Google Colab for data visualization if I’m not a programmer?
- Yes, Google Colab provides a user-friendly interface that allows users of all levels to create visualizations without writing code.